Kotulc github


- You can also find me at:
 bitbucket.org
 frwheelworks.com
 linkedin.com
Jupyter Notebooks
I have found Jupyter Notebooks to be a great tool for both documentation and learning to work with new libraries and tools. Below are a few of my notebooks that include code for plotly, pandas and scikit. Because these are largely visual in nature, I have included links the rendered version of the notebooks using Jupyter nbviewer.
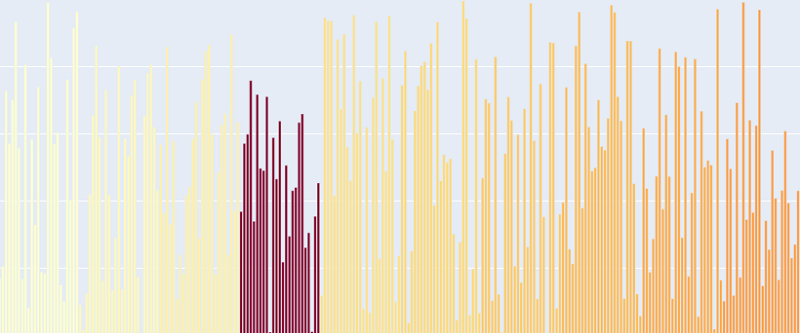
net_charts
This notebook briefly covers creating some simple stylized charts using pandas and plotly. This was an exercise in working with these two libraries and exploring a few methods for displaying tightly clustered data from a network layer.
Render this notebook with nbviewer
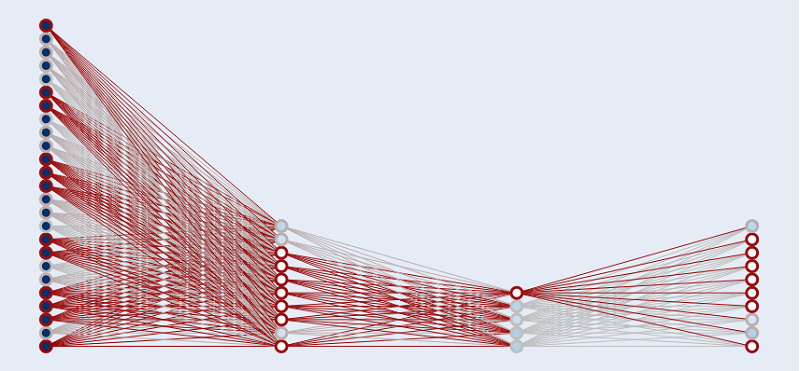
net_graph
Once I had a better grasp on these two libraries, I attempted to create a graphical representation of each network layer using a plotly graph plot. This notebook is a guided walk through the process of creating and animating this plot.
Render this notebook with nbviewer
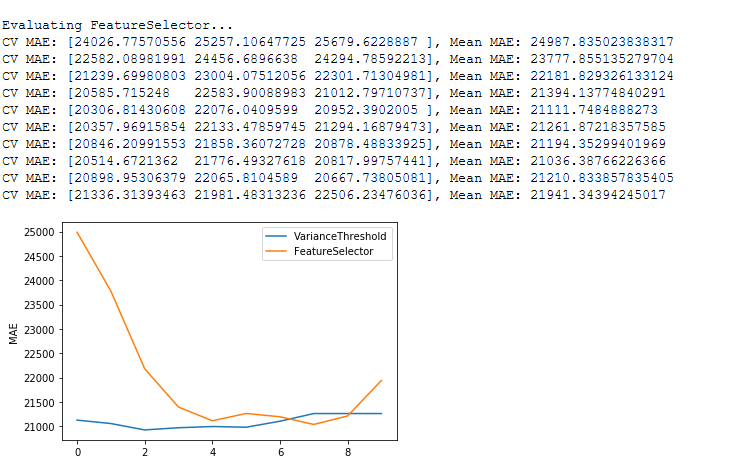
scikit_pipelines
The scikit_pipelines notebook covers the basics of sklearn pipelines using the entry-level Kaggle house data set for illustrative purposes.