Kotulc github

- You can also find me at:
 bitbucket.org
 frwheelworks.com
 linkedin.com
Visualizations Project Page
The goal of this project is to create a convienent framework for combining and animating matplotlib components (subplots) concurrently. The final combined plot is akin to a dashboard with the single purpose of displaying multiple subplots, each with one or more different sources of sequential data.
Component subplots may be updated on a step or sub-step schedule, meaning that select subplots can display information at different rates or resolutions. The sub-step animation support provides an additional layer of flexibilty when displaying sequential data that may have been collected at different intervals. For more information regarding use and functionality please see the project wiki page (this should be added shortly).
Find the source for this project on Github
Getting Started
View the latest documentation built with Sphinx hosted by ReadTheDocs.
Before using this framework, it is strongly suggested that you start by familiarizing yourself with Matplotlib’s pyplot interface using the following Matplotlib tutorial.
For ease of use, it is recommended that you setup a virtual environment to install and run this framework.
If you haven’t worked with virtual envionrmnets before, you may use a platform like Anaconda or Miniconda.
Installation
Use the included requirements.txt to install all required dependencies:
pip install -r requirements.txt
Alternatively, if you want to run just the base subnet_plot module, you may be able to simply install Matplotlib:
pip install Matplotlib
Once you have installed the dependencies you can run some sample animations by calling subnet_plot. See the project documentation for more details.
Subplot Components
A small selection of custom components are included to serve as an example of how to implement Matplotlib objects into this framework. See below for a brief description of each class along with links to the relevant Matplotlib documentation.
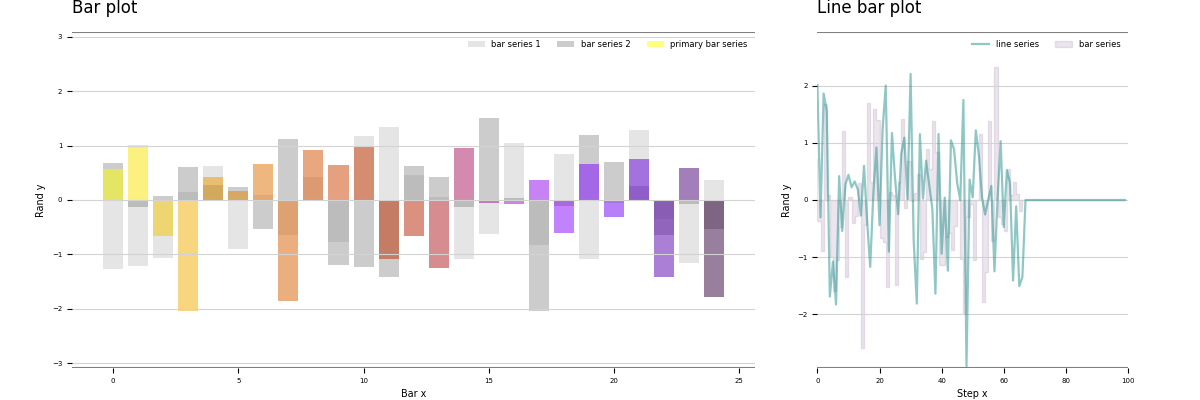
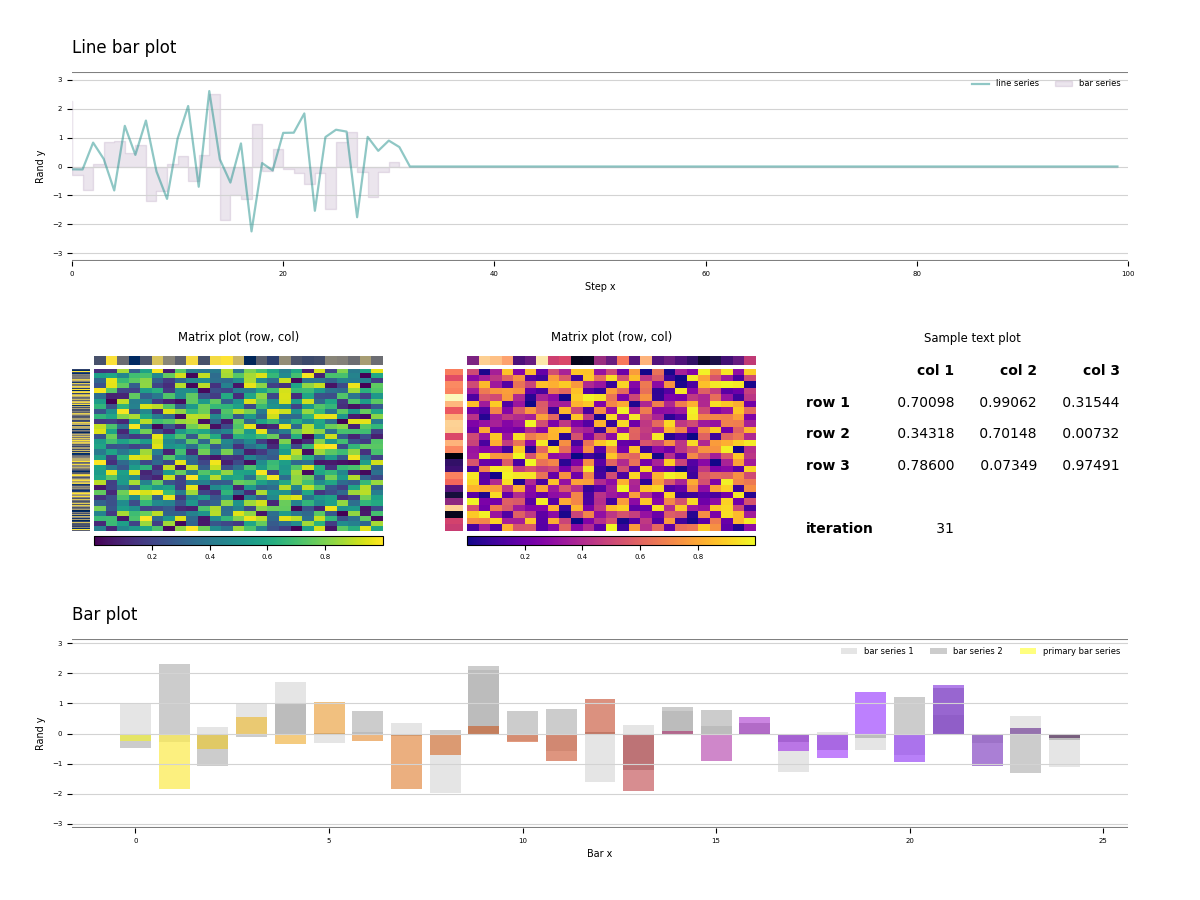
Above, a simple combined bar and line plot from display_sample_plots().
Bar subplot
The bar subplot displays primary elements using the supplied colormap while displaying the optional secondary elements in grayscale.
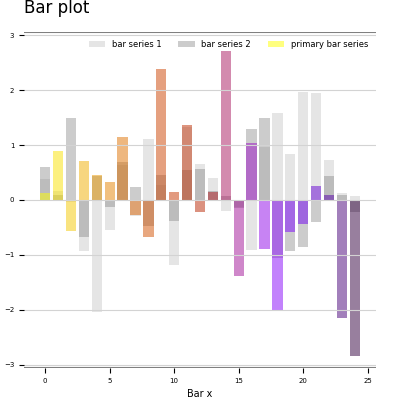
The SubplotBar class is based on the Matplotlib bar object.
Line subplot
The line subplot combines the basic line and bar plots. The optional bar data source is rendered behind the primary line data.
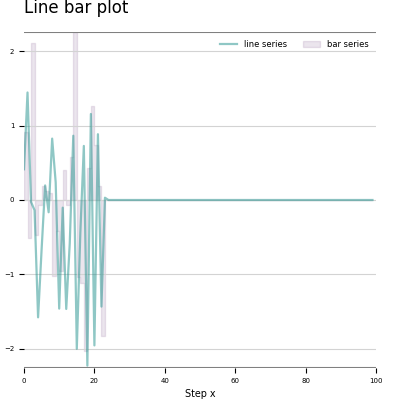
The SubplotLine class is based on the Matplotlib plot object.
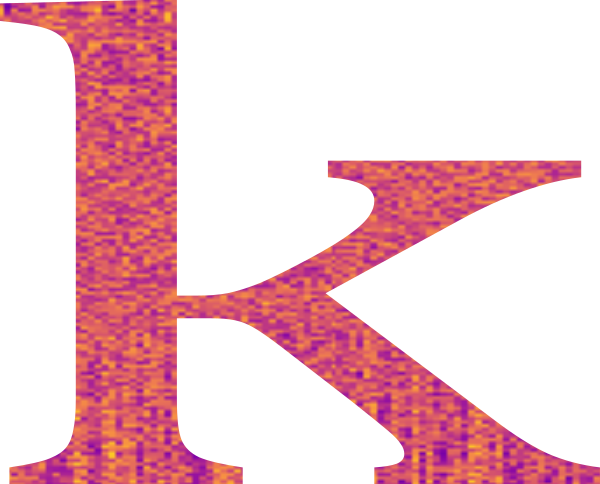
Matrix subplot
The matrix subplot renders a 2-dimensional array in sequential steps with optional 1-dimensional arrays affixed to the left and top sides of the central matrix.
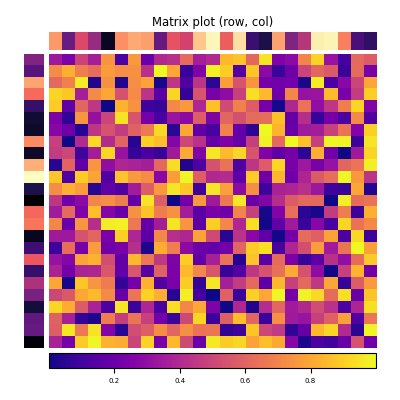
The SubplotMatrix class is based on the Matplotlib image object.
Also see the imshow axes.
Text subplot
The text subplot displays data using a text-based readout. The primary data source is rendered within a table, while a secondary data source is displayed in rows below the primary table.
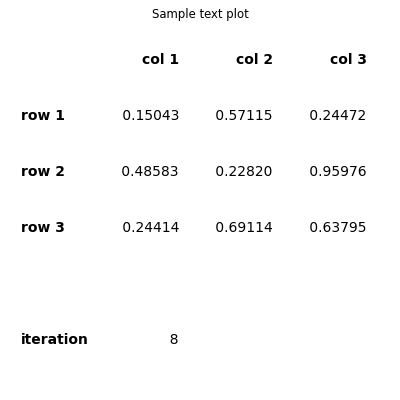
The SubplotText class component is based on the Matplotlib table object.
Layouts and gridspec
The figure’s grid-based layout is defined by the gridspec object passed to add_subplot() when adding subplot objects to the parent SubnetPlot.
For a complete description of Matplotlib’s gridspec please take a look at the tutorial.
Styles and color maps
Each subplot component’s style is defined by the tempalte SubnetSubplot class. Colormaps are used extensively to render plot elements. See the colormap reference for valid values.
Screenshots
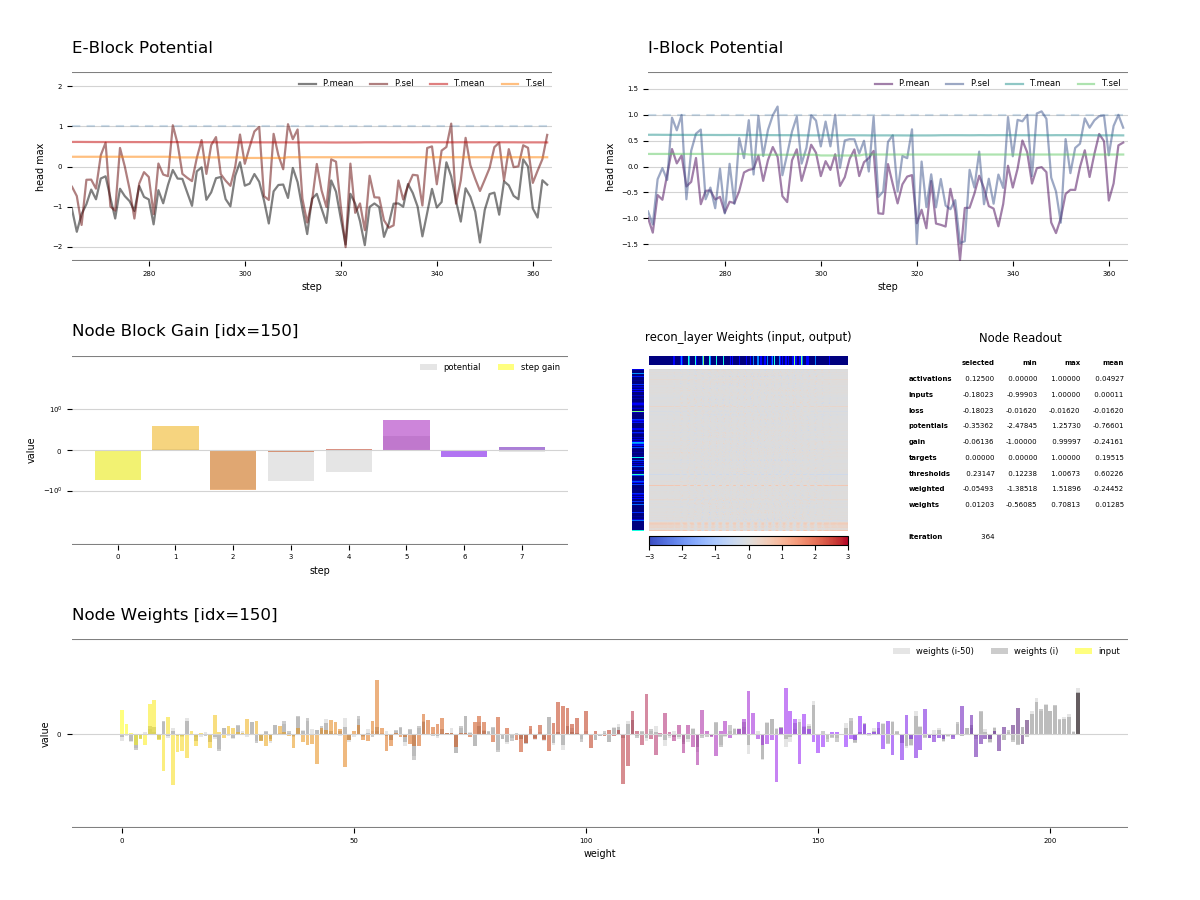
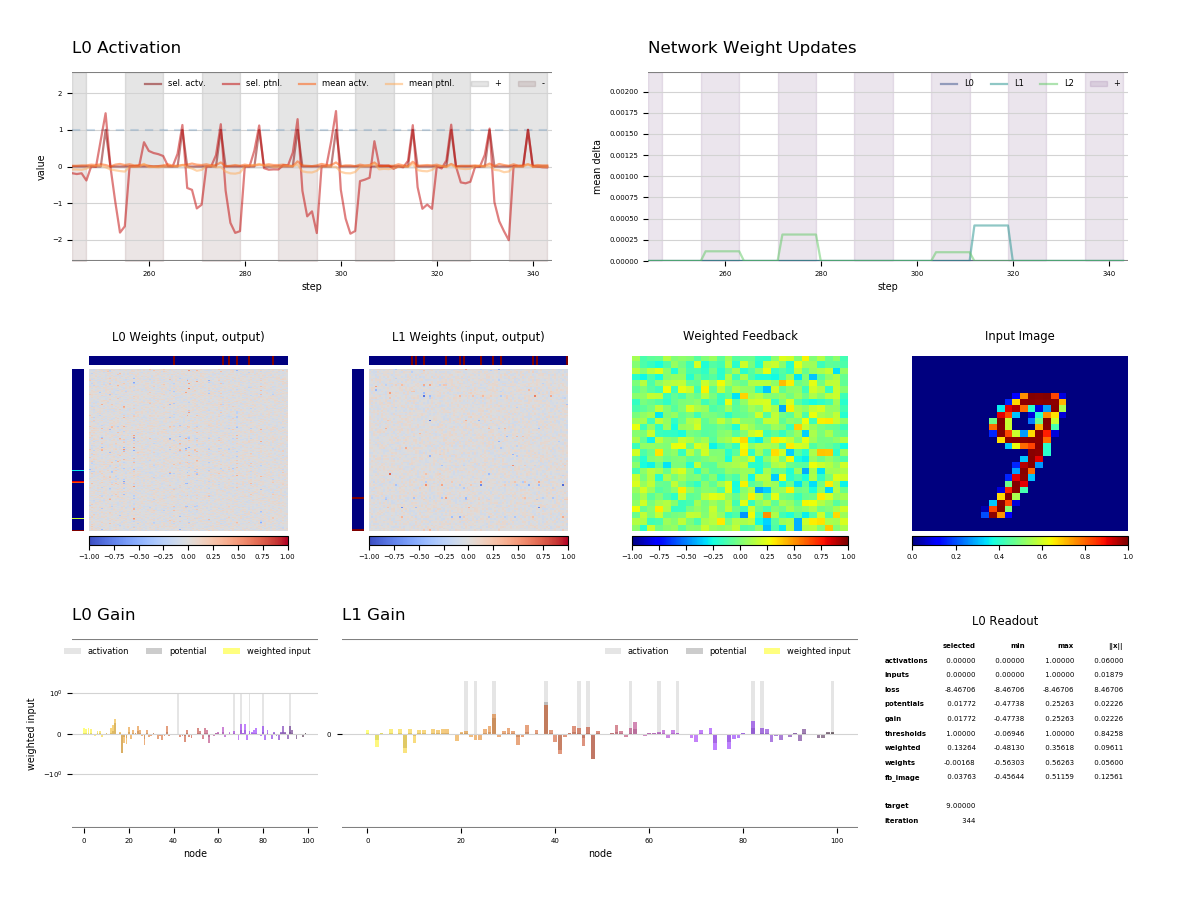
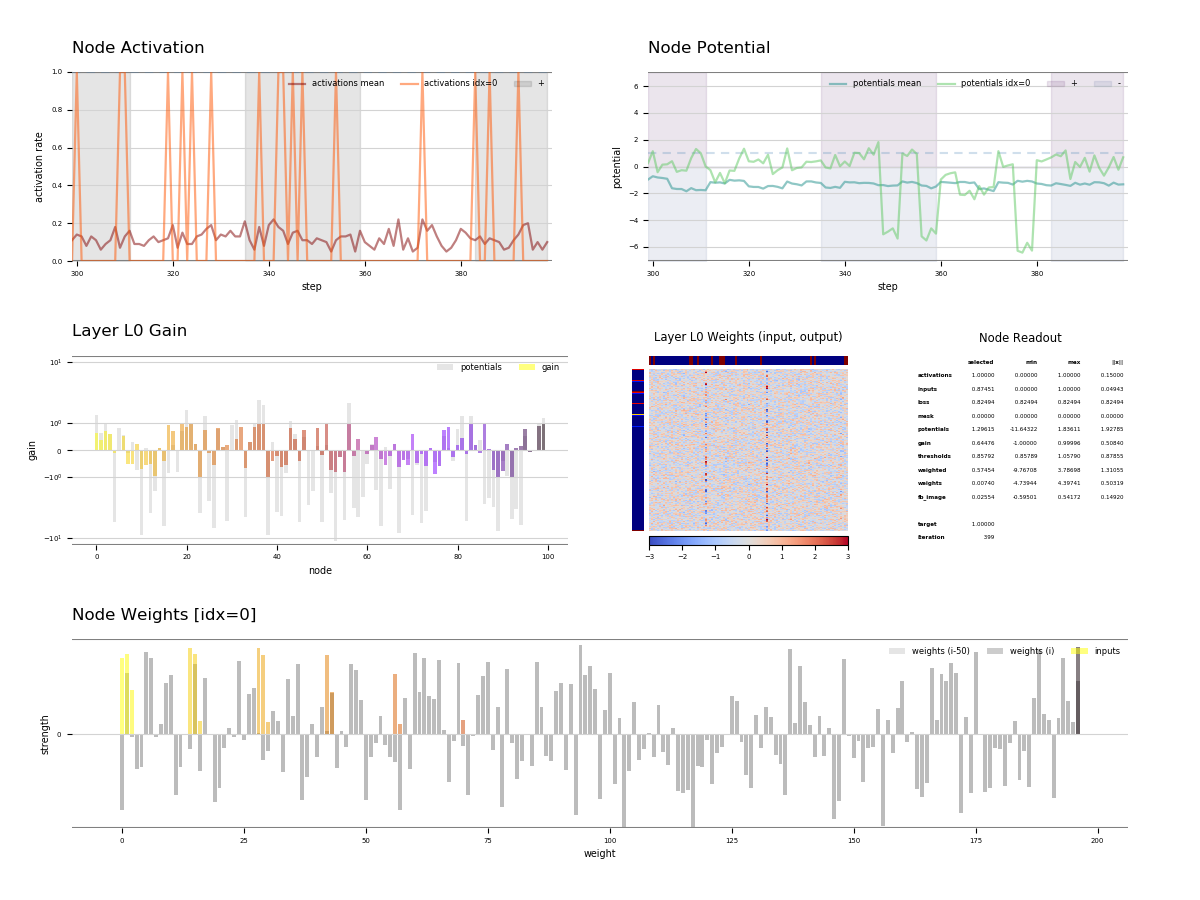
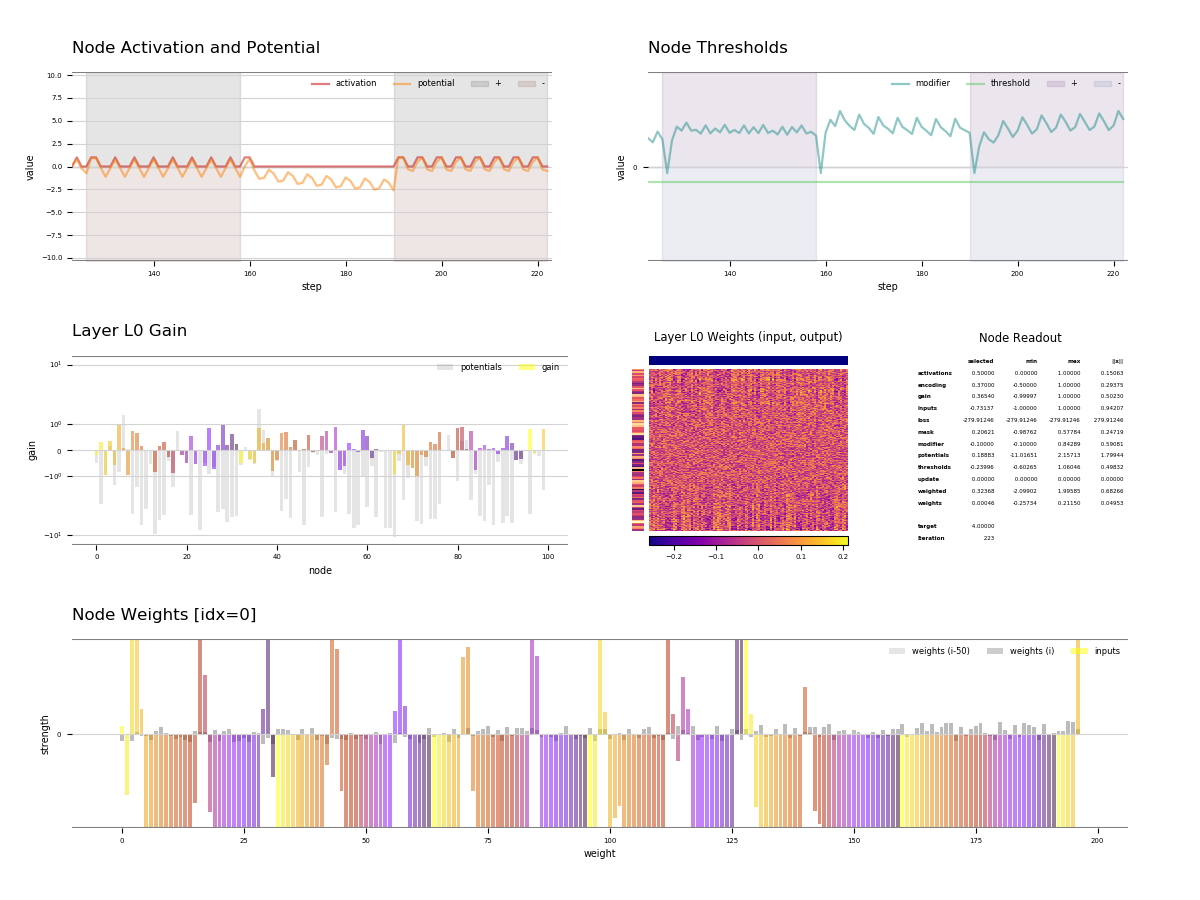
As of the current release, the following screenshots are from the subnet_visualize module:
A network layer with an MNIST input sample
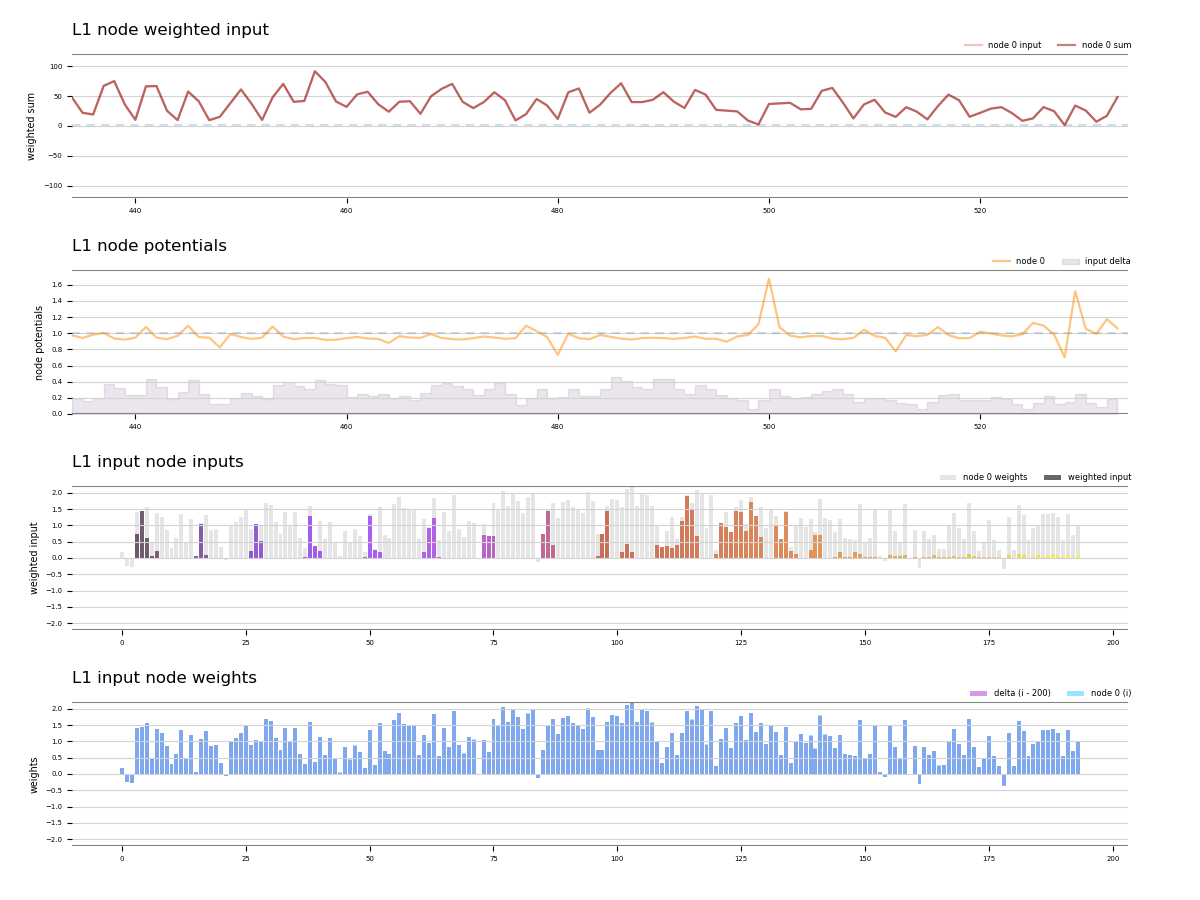
A node specific combined representation
The latest sample found in subnet_visualization
Below are a few samples of older visualizations from previous versions of this project:
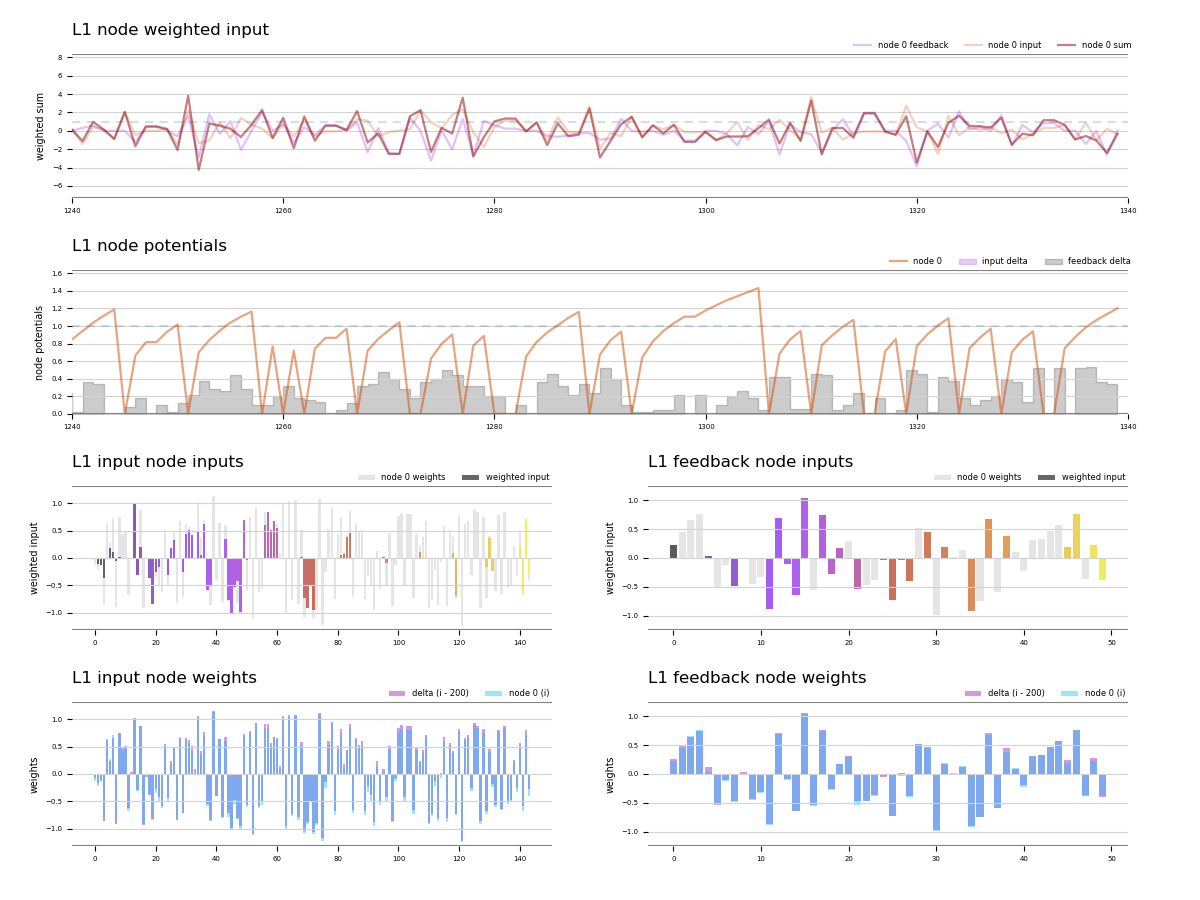
An early node specific representation
A step-based display with node selection